We’re knee deep into our data unit! I’ve been busy, busy, busy teaching them how to create scaled bar graphs. I tapped into their “we’re giddy for Halloween” energy and created these Halloween graphing resources. These Halloween graphing activities provide hands on practice for classifying, sorting, organizing data, graphing using picture graphs and bar graphs, and interpreting information. This post will share all about these Halloween graphing activities and how to use them in your classroom. These activities make teaching elementary math in October fun!

What is included in this Halloween Graphing Resource?
This Halloween graphing activities resource includes the following:
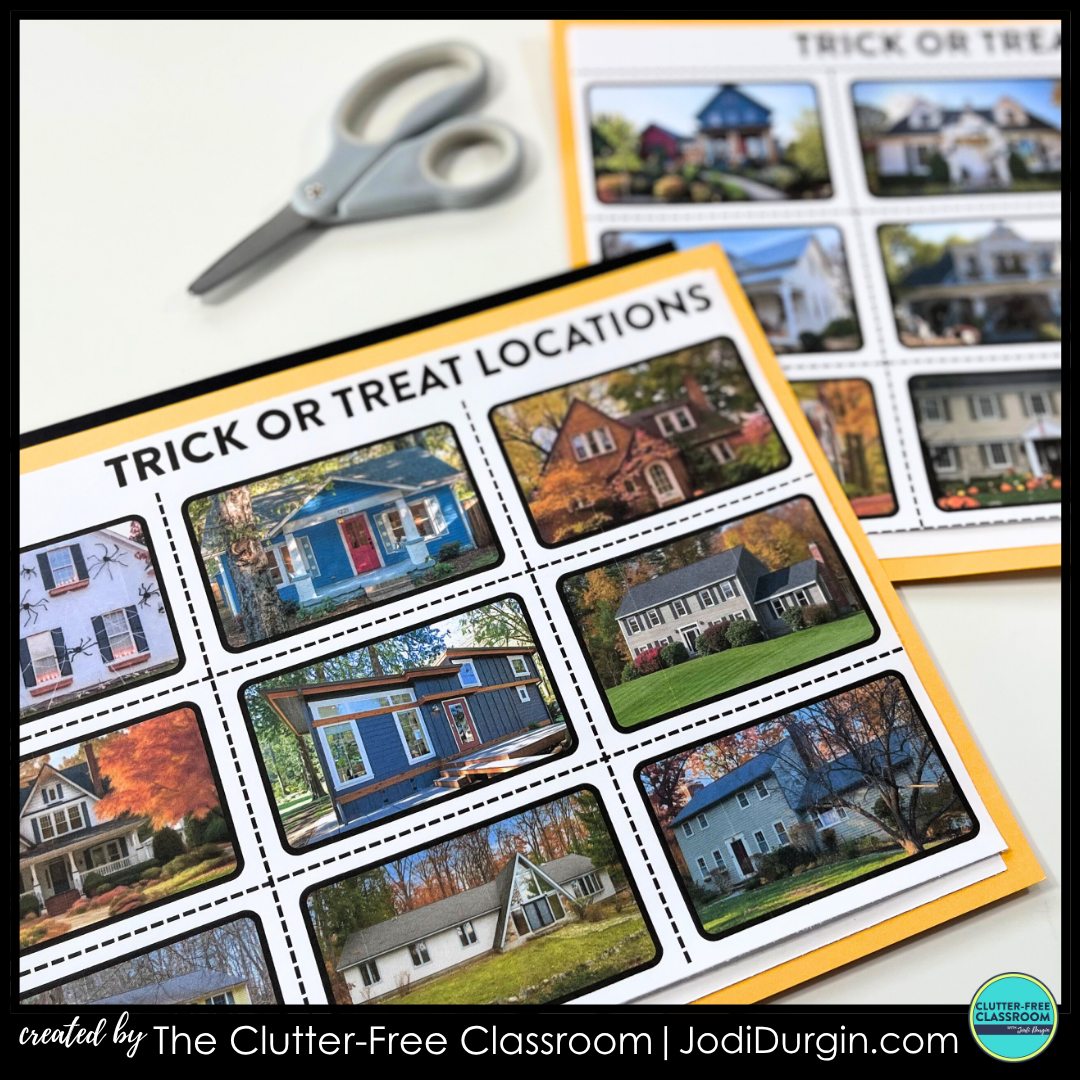
- 6 Sets of sorting cards (one set of word cards and five sets of picture cards)
- 3 Sorting mats (2, 3 and 4 sorting categories)
- 6 Recording sheets (3 bar graph options and 3 picture graph options)
- 16 Task cards (8 anytime cards and 8 graph challenges)
- Center direction table tent signs


Why Teachers Love the Halloween Graphing Activities
Teachers love the Halloween graphing activities because…
- Students are highly engaged when working with the sorting cards, mats and recording sheets.
- There are tons of options to choose from, so they can decide what works best for them and their students.
- The printables require very little prep, which saves them lots of time.
- They are great filler and fast finisher activities, so they’ll be covered in a pinch.
- The Halloween theme makes it so students don’t even realize they are learning!


Why Students Love the Halloween Graphing Activities
Students love the Halloween graphing activities because…
- They enjoy sorting and organizing the colorful picture cards, which makes learning hands-on and fun.
- The simple, visual format helps them understand data more easily without feeling overwhelmed.
- The Halloween theme makes learning extra fun!
- There are differentiated materials included, so all students can feel confident and successful.
- The center directions gives older students the opportunity to work independently.


What Standards Do These Halloween Graphing Resources Address?
These Halloween graphing resources address the following Common Core State Standards:
- K.MD.B.3: Classify objects into given categories; count the numbers of objects in each category and sort the categories by count.
- 1.MD.C.4: Organize, represent, and interpret data with up to three categories; ask and answer questions about the total number of data points, how many in each category, and how many more or less are in one category than in another.
- 2.MD.D.10: Draw a picture graph and a bar graph (with single-unit scale) to represent a data set with up to four categories. Solve simple put-together, take-apart, and compare problems1 using information presented in a bar graph.
- 3.MD.B.3: Draw a scaled picture graph and a scaled bar graph to represent a data set with several categories. Solve one- and two-step “how many more” and “how many less” problems using information presented in scaled bar graphs. For example, draw a bar graph in which each square in the bar graph might represent 5 pets.

How to Implement the Halloween Graphing Resource in Your Classroom
Below are some ideas for how to implement the Halloween graphing resources in your classroom.
Kindergarten Halloween Graphing Activities
Where are my kindergarten teacher friends at? Here are some suggestions for how to implement these Halloween graphing activities in your kindergarten classroom:
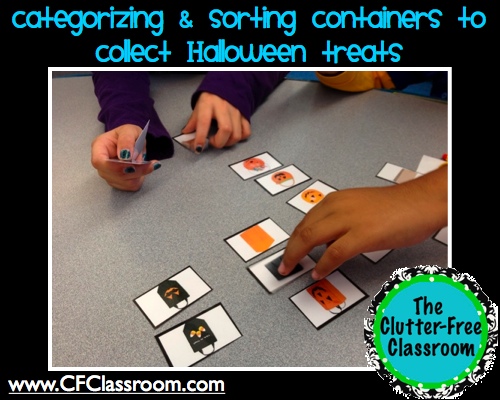
- Sort the cards into categories in a small group or whole class.
- Count the cards in each category.
1st Grade Halloween Graphing Activities
Hey 1st grade teachers! Here are some suggestions for how to implement these Halloween graphing activities in your 1st grade classroom:
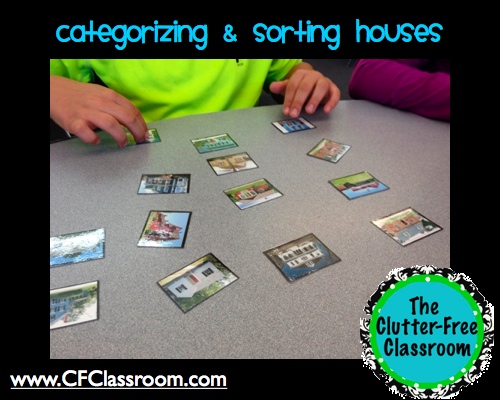
- Look at a collection of cards and brainstorm up to 3 categories for sorting them into.
- Sort the data into the 3 categories.
- Create a chart together as a class.
- Ask and answer questions about the total data points on your graph.


2nd Grade Halloween Graphing Activities
Calling all 2nd grade teachers! Here are some suggestions for how to implement these Halloween graphing activities in your 2nd grade classroom:
- Look at a collection of cards and brainstorm up to 4 categories for sorting them into.
- Sort the data into the 4 categories.
- Invite each student to draw a picture graph and bar graph with a single unit scale to represent the data.
- Have students complete the task cards using their graphs, their classmate’s graphs, or graphs you generate as a class.
3rd Grade Halloween Graphing Activities
Hey there 3rd grade teachers! Here are some suggestions for how to implement these Halloween graphing activities in your 3rd grade classroom:
- Use the cards to reinforce sorting and categorizing. Have each student (or group of students) write lists of possible categories for sorting each collection of cards.
- Invite students to use the data presented on task cards to draw scaled picture graphs and scaled bar graphs.
- Have students complete the task cards using their graphs, their classmate’s graphs, or graphs you generate as a class.


4th Grade Halloween Graphing Activities
Hey 4th grade teachers! Here are some suggestions for how to implement these Halloween graphing activities in your 4th grade classroom:
- Challenge students to create their own survey questions based on the Halloween picture cards and collect data from classmates.
- Have students sort the data into meaningful categories and represent it using scaled bar graphs and picture graphs.
- Encourage students to write multi-step word problems based on their graphs and trade with classmates to solve.
- Use the task cards as extension activities for early finishers or for math center rotations.
- Incorporate academic vocabulary like “data,” “category,” “scale,” and “interval” to deepen understanding and support math talk.


Get the Halloween Graphing Activities

Related Halloween Activities
Below are some other popular Halloween activities you might be interested in.


In closing, we hope you found these Halloween graphing activities helpful! If you did, check out these other Halloween activities for elementary students.